.png)

MFV Tech Talk #3 - Service Operation | Kitto & Leon
.png)
1. Overview
1.1 Definition
According to IT Infrastructure Library(ITIL), service operation is one in five stages of an IT service lifecycle as in the following image. Each stage has a purpose and several processes defined and collected from many sources that were proven in reality to achieve this purpose.

Service operation makes sure that IT services are delivered effectively and efficiently. ITIL defines service operations including some main processes:
Event management
Incident management
Request fulfillment
Access management
Problem management
Facilities management
Application management
Technical management
1.2 How to apply it in reality
The list of processes in ITIL operation management was built and collected from many simple and complicated cases. It will be bulky if you want to apply all of them to a simple case or a small product with a small team. So the answer to the question “how to apply it ?” is “it depends on the case, the context”. We don’t need to use all the processes. In MF, we apply three processes and it’s enough for the current status of the product and the company:
Event management
Incident management
Request fulfillment
Some factors will be helpful when choosing your processes:
Development team: size, knowledge, etc
Product size and requirements and business
1.3 Engineering viewpoint
ITIL has many definitions that help you understand the high level of each stage in IT service lifecycle. But for IT engineers, especially those who want to apply it to IT services and build it by hand, we need to see it from a viewpoint familiar with engineering knowledge. In MF, we promote a viewpoint for easy to look at and apply service operation:

System monitoring makes sure you collect necessary events and monitor them all the time. While the operation process will lead you to action with all the monitoring information(event, alert based on event).
With this viewpoint. You can implement it step-by-step.
2. System monitoring
2.1 How monitoring work

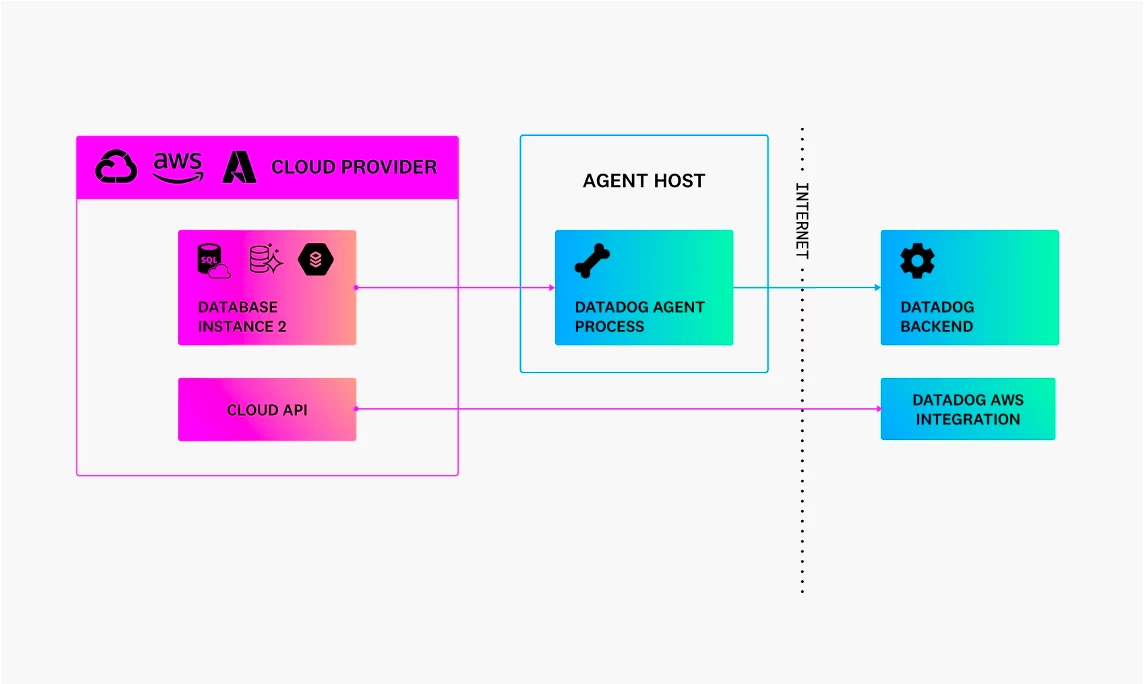
Every monitoring tool was built with the agent-server model:
Agent: will be injected anywhere we want to monitor to collect data that was configured
Server: Receive data from agents by pulling or pushing patterns and do all the post-processing
Some monitoring tools allow to pushing of data directly with an exposed API. It will be useful in case of short-term services like serverless
In Money Forward, we use Datadog as the main monitoring tool and monitor service work on AWS.
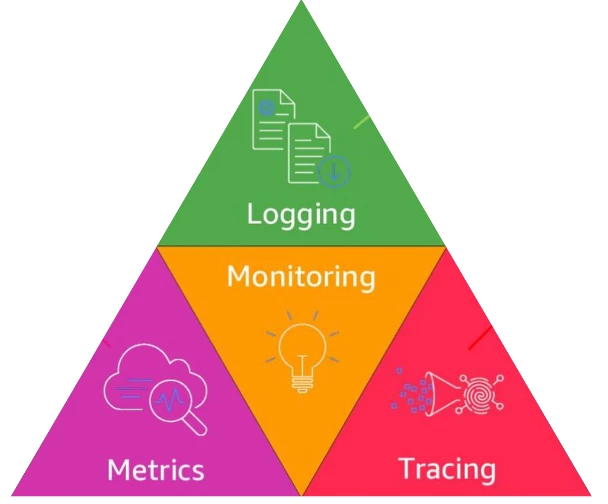
2.2 Three pillars of observability

Every monitoring tool works around three main objects: log, trace, and metric as known as three pillars in a big pillar-story of monitoring.
With each object, the monitoring tool provides some functions:
Collect
Transform
Archive
Index
Visualize
2.3 Log
Log needs to be:
Design
Collect and transform
Archive
Index, explore, and analyze
Some best practices and processing with log:
2.3.1 Structure and format
As recommended everywhere in the tech world, we should use a structured log. A structured log is a type of machine-readable information. It’s easy to read, process, and index by machine. In MF, we use JSON as the best practice log format with a good structure was built.

2.3.2 Common fields
A log needs to have some common fields to show us basic information. In MF log, we have some common fields:
Level(Info, Warning, Error)
Time
Message
UserID: this log belongs to which user
OfficeID(TenantID): In tenant application
AppID: Sometimes we use monolithic and have more than one application deploy in the same service. AppID is good for separating log from many applications
RequestID&TraceID: Bind them in a processing follow and we can filter to get logs of a request processing
Stacktrace: Good to see where an error was pulled out from the the code. It will be helpful for debugging error cases
2.3.3 RequestID and TraceID
RequestID and TraceID as mentioned above help us to trace all the logs belonging to a request or flow processing. In our experience, RequestID and TraceID should reveal not only an ID for request or flow but also many important information. For example in Accounting Cloud service, we have a structure of RequestID and TraceID:
YYYYMMDDYYYYMMDDYYYYMMDDYYYYMMDD: 8 chars for time information. Ex: 20221011
APPID: 2 chars for app id information
FeatureID: 4 char for feature id information
2.3.4 Collect log
Check on tech talk video at the end to see more about collecting log on AWS ECS and Serverless 22 and 23
2.4 Trace
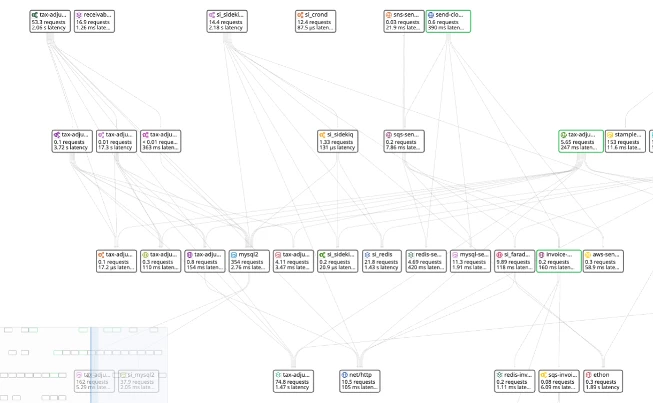
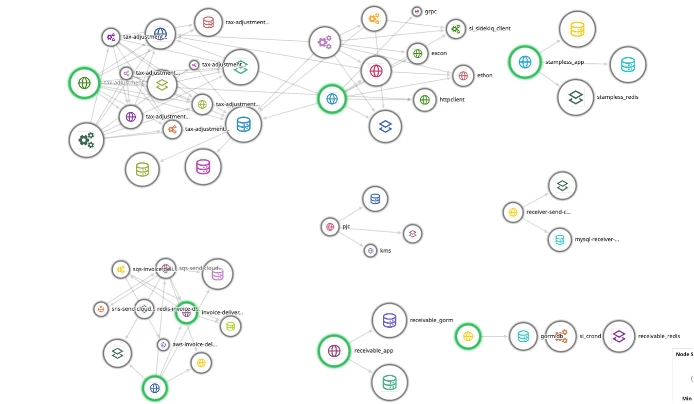
Trace helps us to understand the full path a request takes in the application. It’s essential to trace the performance of an application over one or many services in the system.
Some steps need to be done with trace:
Apply trace to code
Collect trace
Explore and analyze trace
Archive
Some best practices with trace:
A reasonable number of spans in trace
Map between many services
Spans in trace must have tags and detail information for tracing purposes
After applying trace, we can build an overview of the system with a monitoring tool


To see more about how we can collect and manage trace, check techtalk video.
2.5 Metric
A metric is a measurement of a service captured at runtime. It helps us to understand the status of services in runtime.
Some best practices with metric:
Collect at least essential metrics: CPU, memory, error rate, latency, network, etc
Define and collect internal application metrics for your special purposes
To get more information, please check out my speach video at the end of this article.
3. Operation Process | SLA/SLO/SLI | Monitoring Dashboard
All details will be elaborated within this video, please enjoy.
.png)
.png)
MFV Tech Talk #3 - Service Operation | Kitto & Leon

